Databrain’s chat mode is an intuitive, conversational interface that allows users to create metrics and visualizations using natural language queriesKey Benefits:
- Natural Language Interaction — Users can simply type questions about their data in plain English, making it accessible to non-technical users.
- Automated Insights Generation — The chat mode responds to queries and also generates visualizations and detailed explanations automatically, streamlining the process of data analysis and reducing manual report generation time.
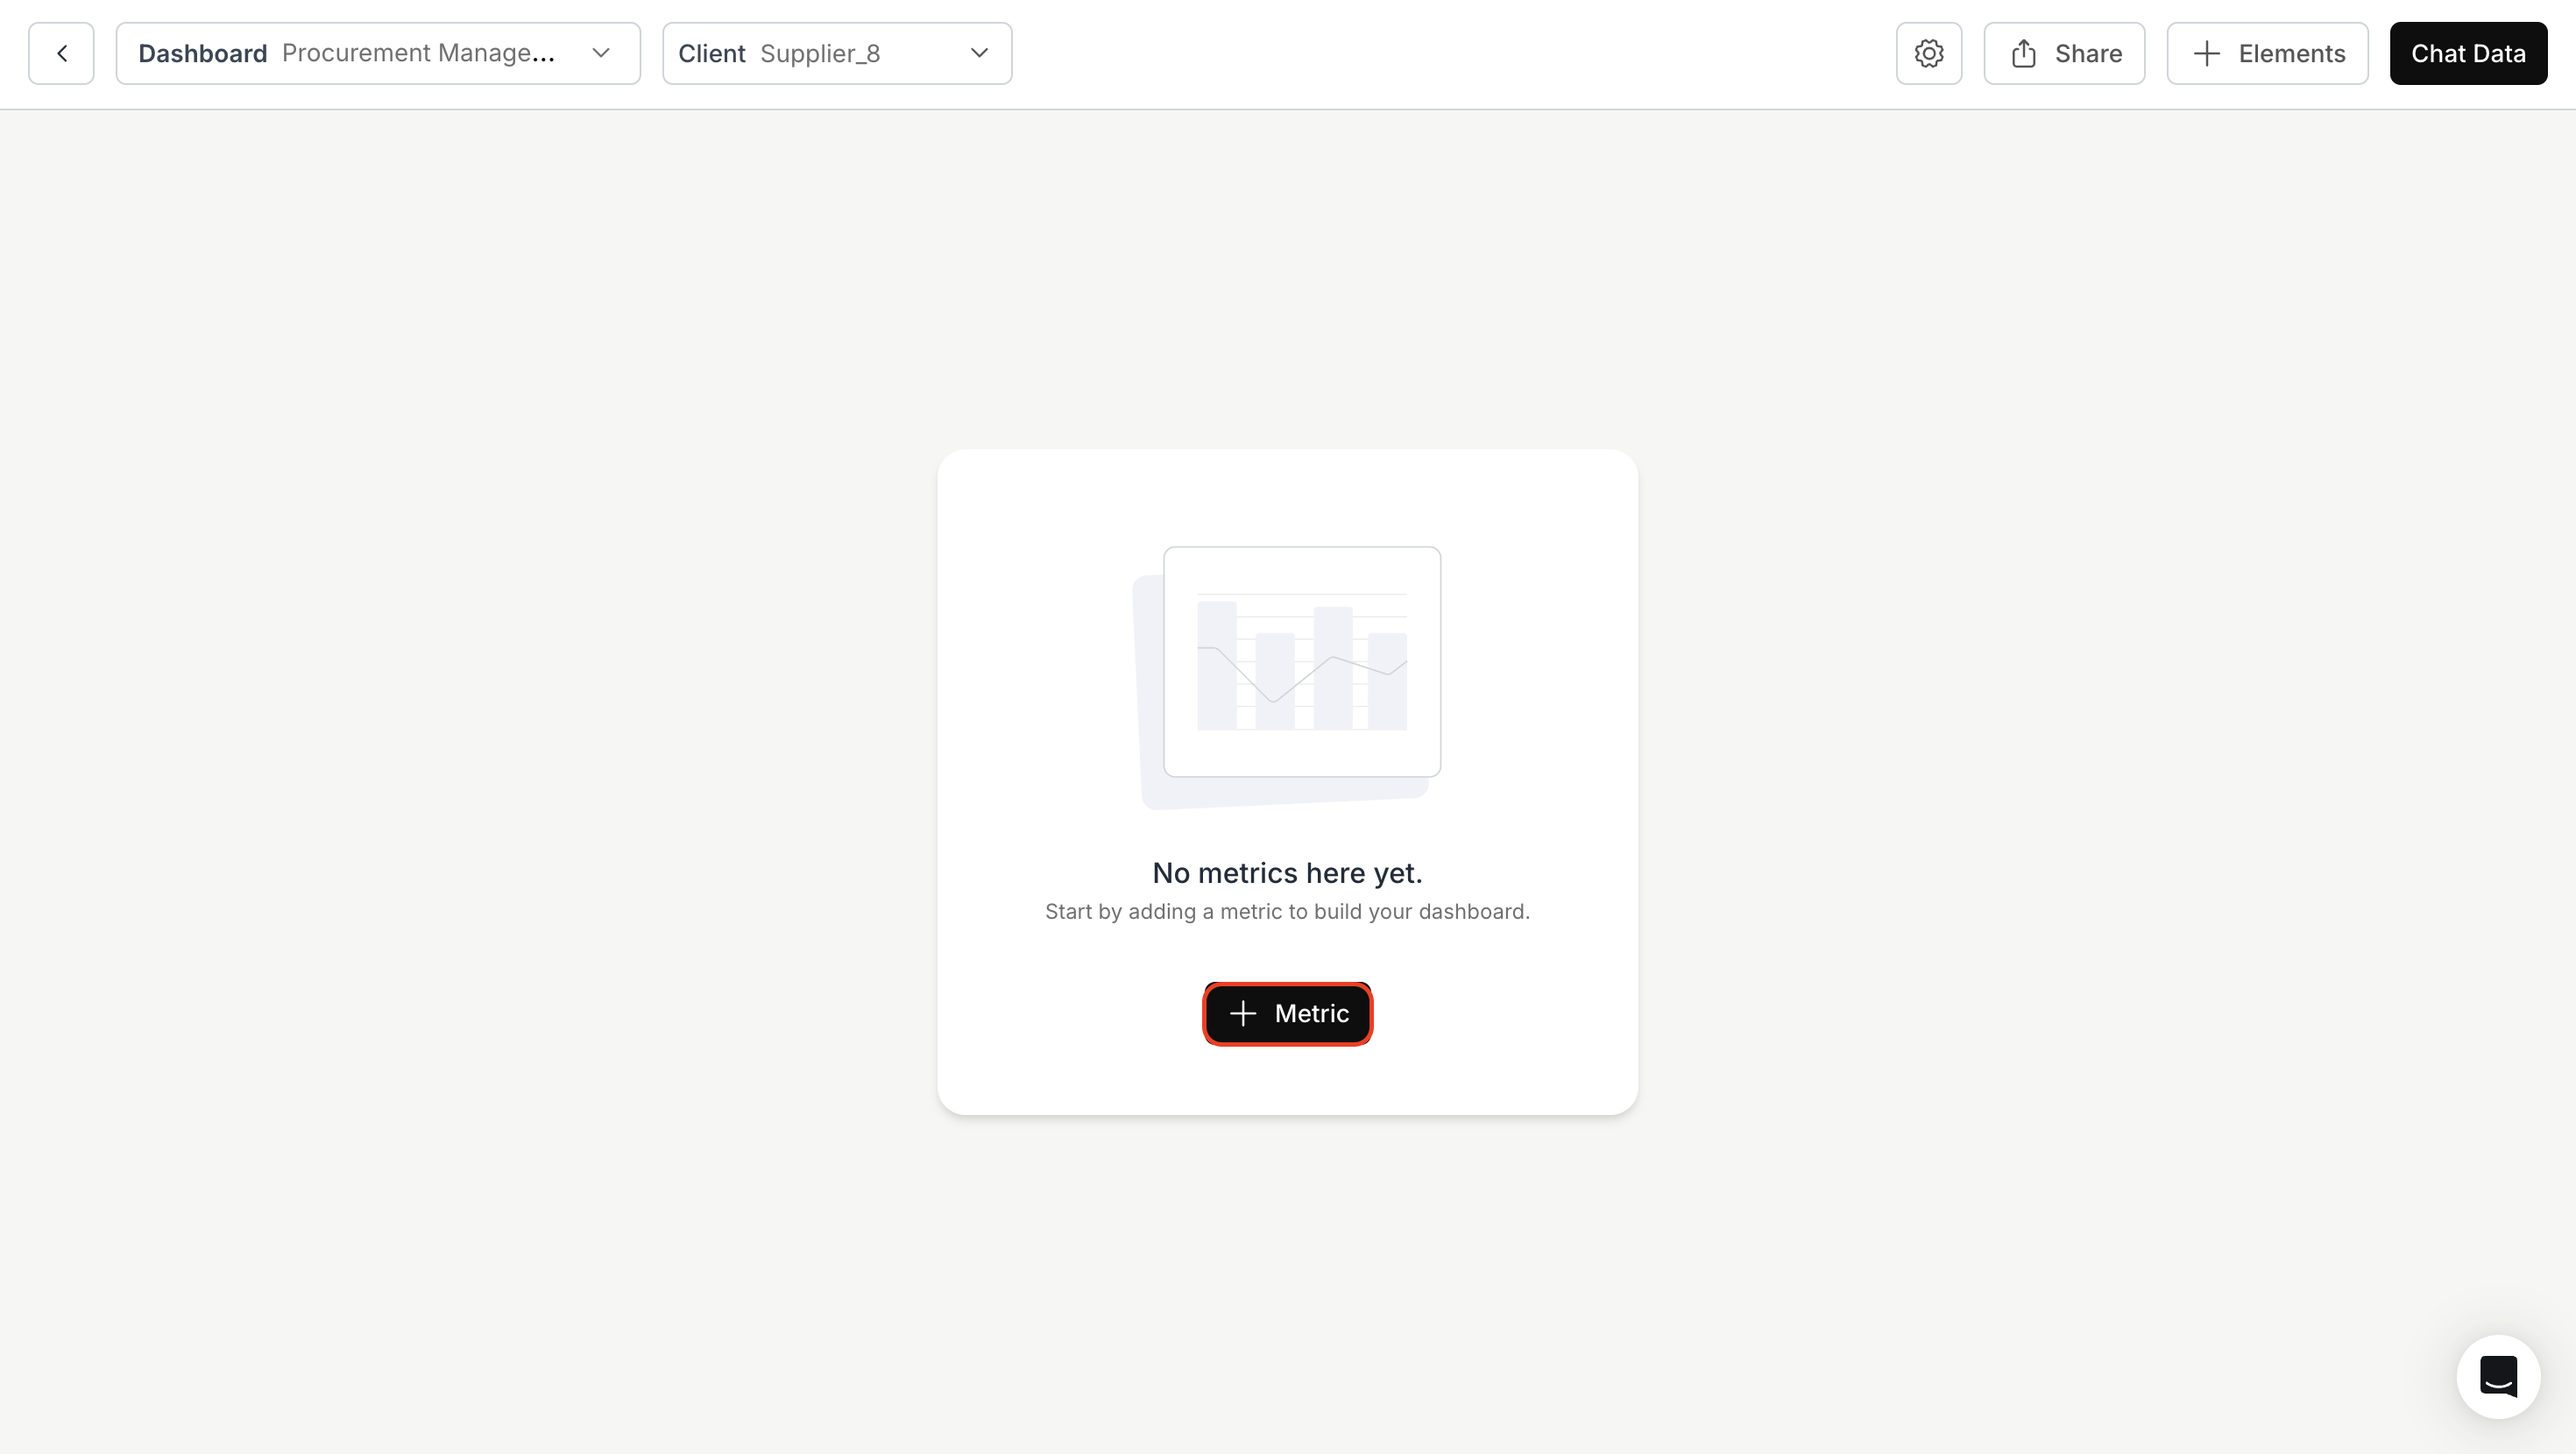
Navigate to Dashboard and Initiate Metric Creation
- Select the dashboard where you intend to add the metric.
- For the first metric, click the + Metric button.
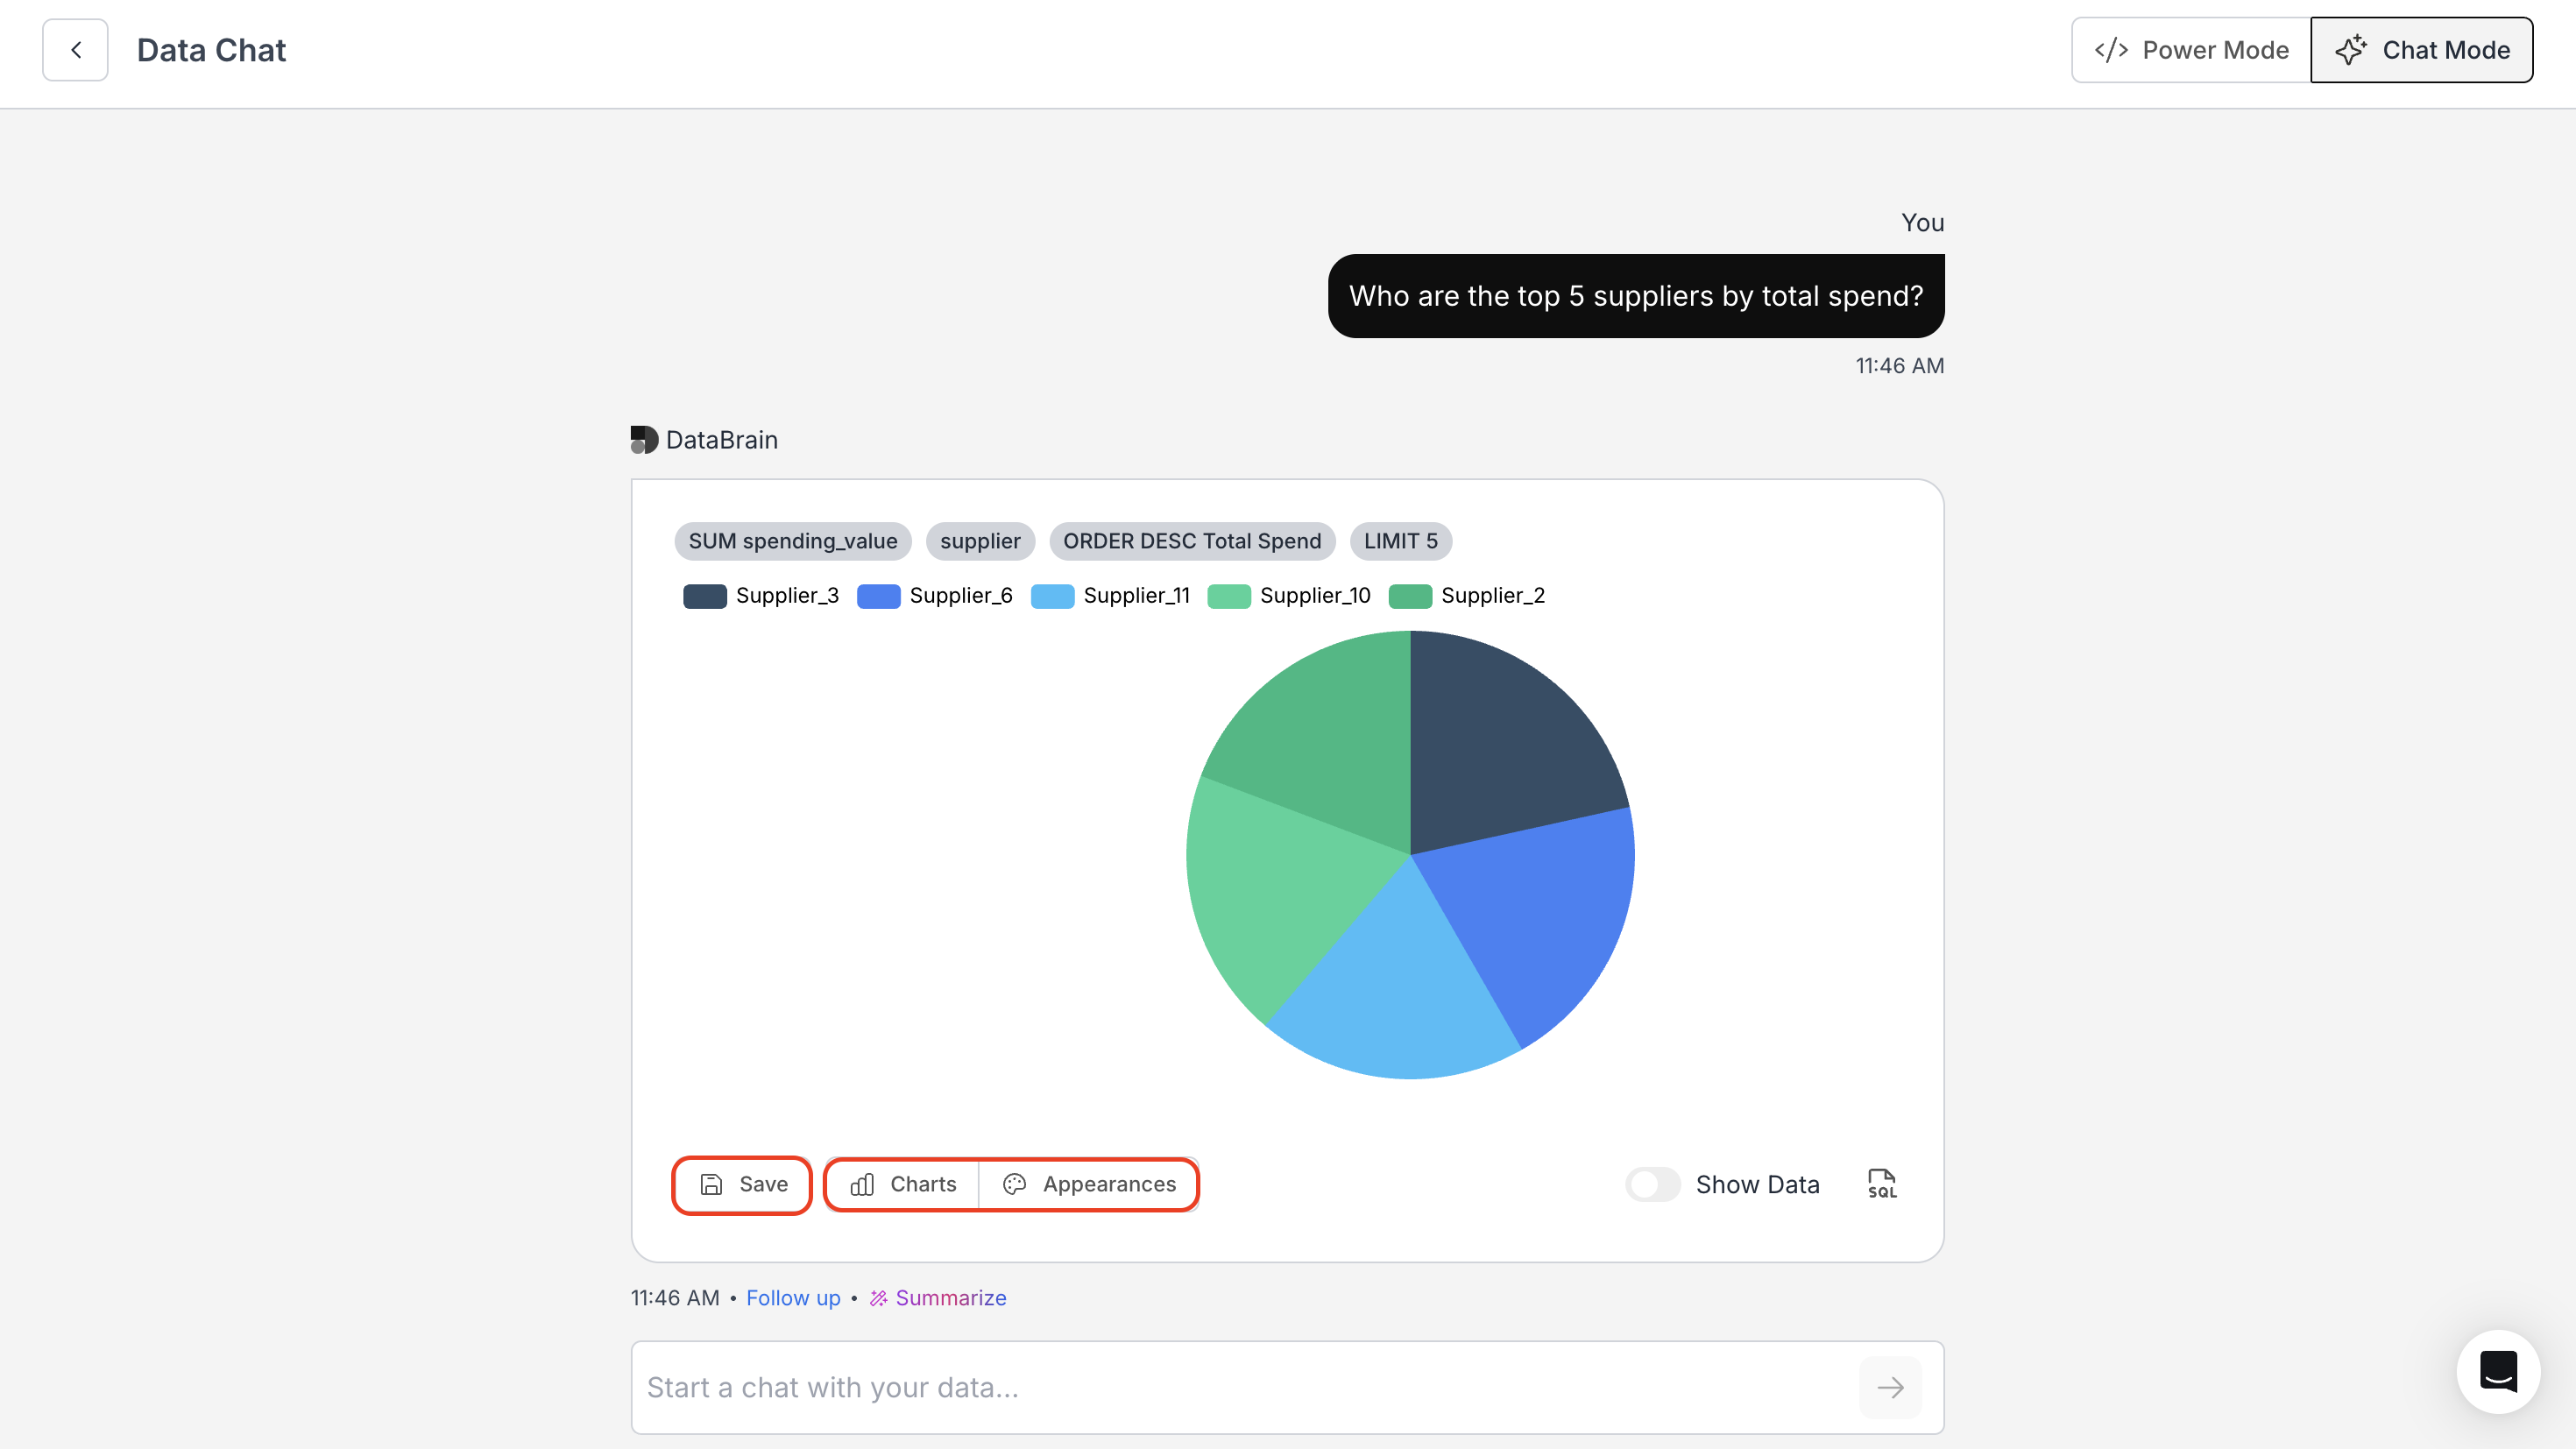
Search for a Question in Chat Mode
Provide an appropriate question based on the metric you want to create, and click on the → icon.
Change Charts and Appearance
- Choose your preferred visualization from the “Charts” icon.
- Customize your graph using the options available in the “Appearances” icon.
- (Optional) Use Summarize to view the AI-generated interpretation, and SQL to view the SQL query behind the visualization.
- Click on Save.
You’ve successfully created a metric using Chat Mode in Databrain!
Your visualization, summary, and configuration are now saved — enabling faster, more intuitive analysis powered by natural language.
Your visualization, summary, and configuration are now saved — enabling faster, more intuitive analysis powered by natural language.